What is New Analytics?
New Analytics provides interactive graphs and tables that allow instructors to track data related to course grades, activity, and communication. Instructors can track student grades, submission status, weekly course activity, individual student participation, and online attendance. Instructors can also use New Analytics to message students based on their submission status or grade.
Viewing New Analytics Data
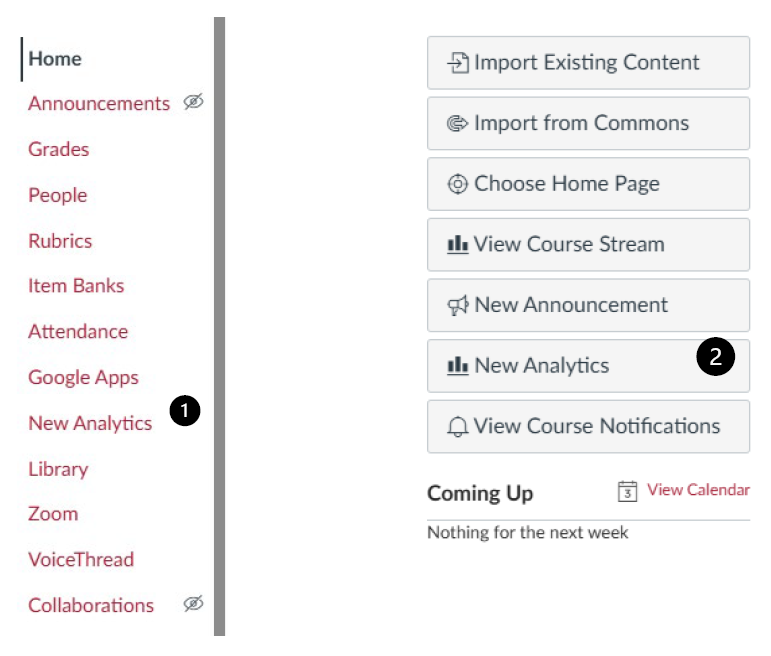
Select “New Analytics” from the Course Navigation [1], if enabled, or the New Analytics button [2] on the Course Home Page.
Using New Analytics as an Instructor

You can perform various activities using the tabs provided in New Analytics:
- Course Grade [1]: View average course grades or compare the course average with an individual assignment, course section, or by student.
- Weekly Online Activity [2]: Access page views and compare the course average weekly online participation analytics with an individual student or section.
- Students [3]: View grade or participation analytics for individual students or review message communication data between you and specific students.
- Reports [4]: Run or download reports on missing, late, or excused assignments.
- Message [5]: Communicate with students based on specific benchmarks you set up, such as course grade or participation criteria.
Additional Related Canvas Guides:
- How do I compare the course average data table with an assignment, section, or student filter in New Analytics?
- How do I send a message to all students based on specific course criteria in New Analytics?
- How do I view and download reports in New Analytics
- What is New Analytics?
- How do I view weekly online activity analytics in an interactive chart graph in New Analytics?